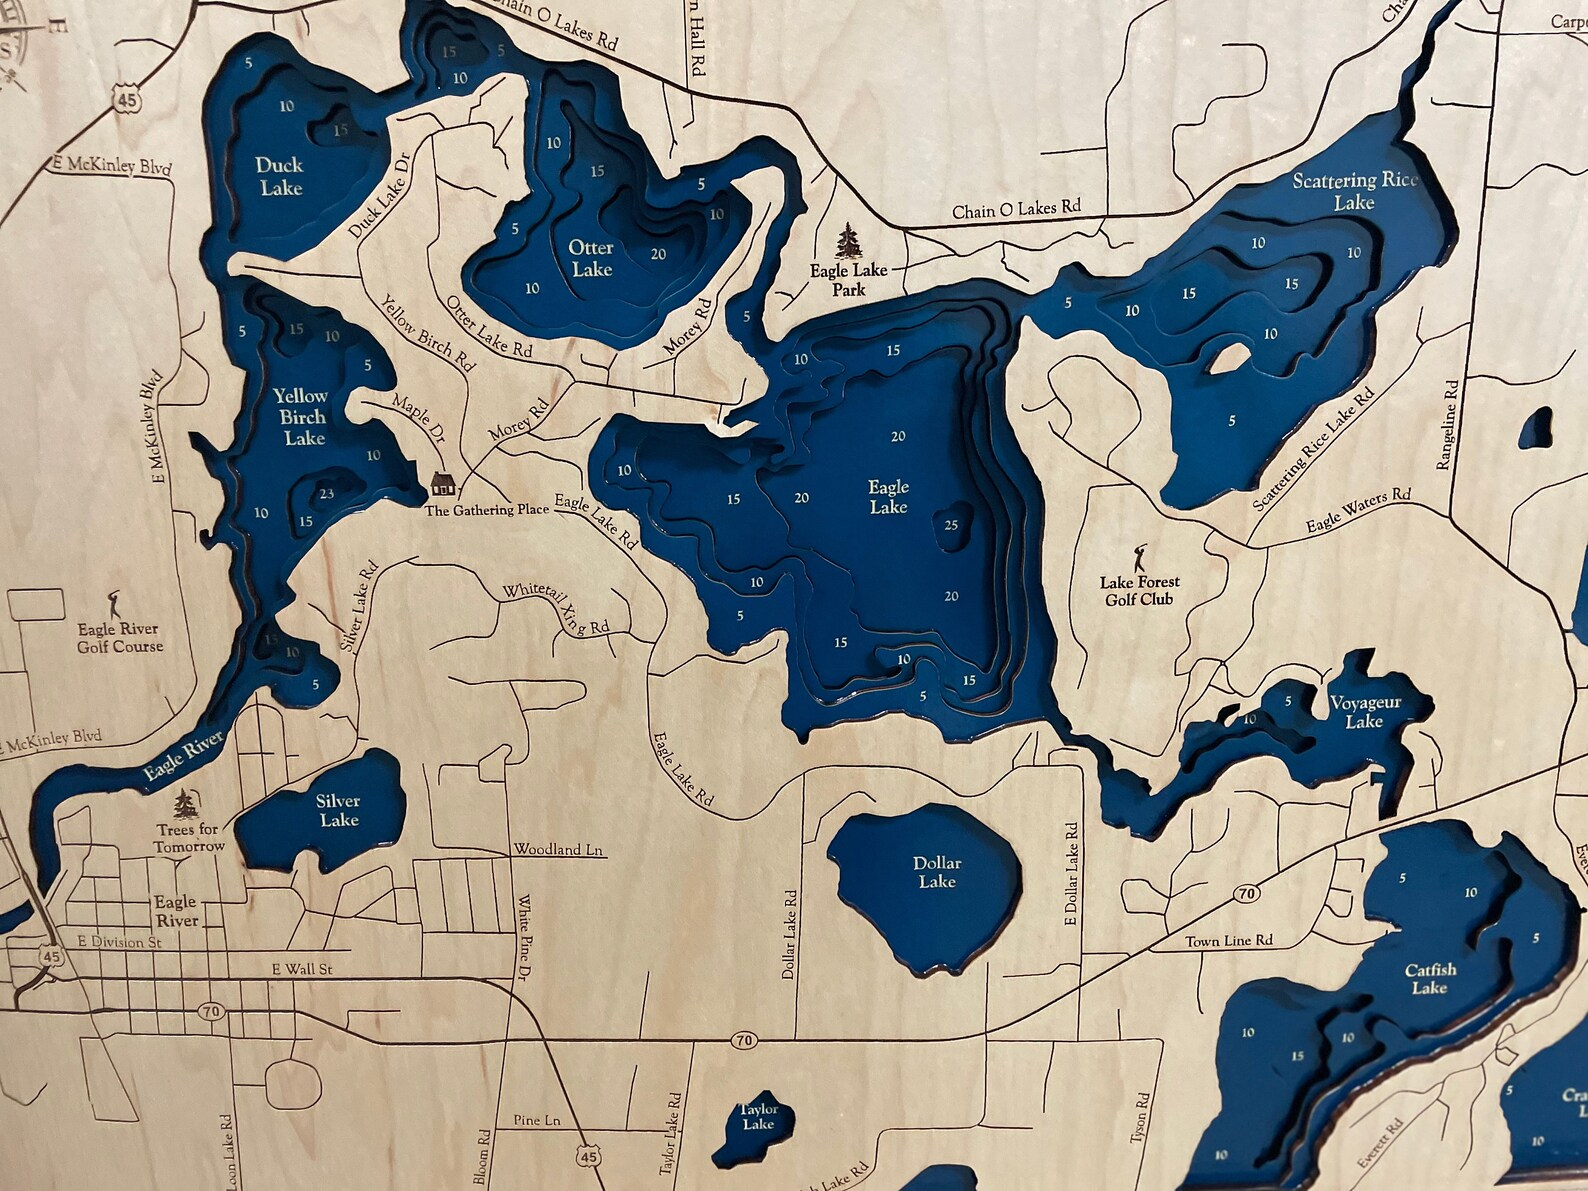
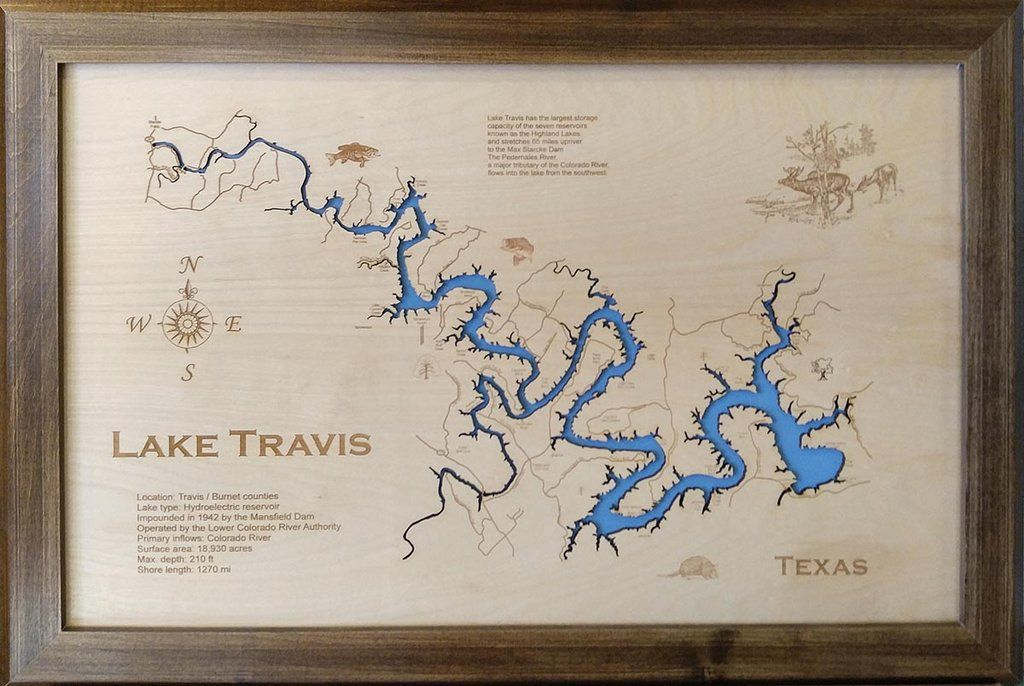
When you think about protecting our waterways, what comes to mind? Maybe it’s the fish swimming in crystal-clear waters or the birds nesting along the shorelines. But there’s another way to see conservation success – through maps. And when we look at places like Lake Travis and Wood Lake, we find stories that tell us exactly how well our conservation efforts are working.
The story of water conservation in Texas isn’t just about keeping the taps running or managing droughts. It’s about understanding how we can protect and restore our most precious resources. Two lakes – Lake Travis and Wood Lake – have become unexpected teachers in this important mission. Through careful mapping and study, researchers have discovered what works and what doesn’t when it comes to preserving our aquatic ecosystems. These insights aren’t just academic curiosities; they’re practical guides for communities across the state. So let’s dive into what these two lakes reveal about conservation and why their lessons matter more than ever.
Understanding the Landscape
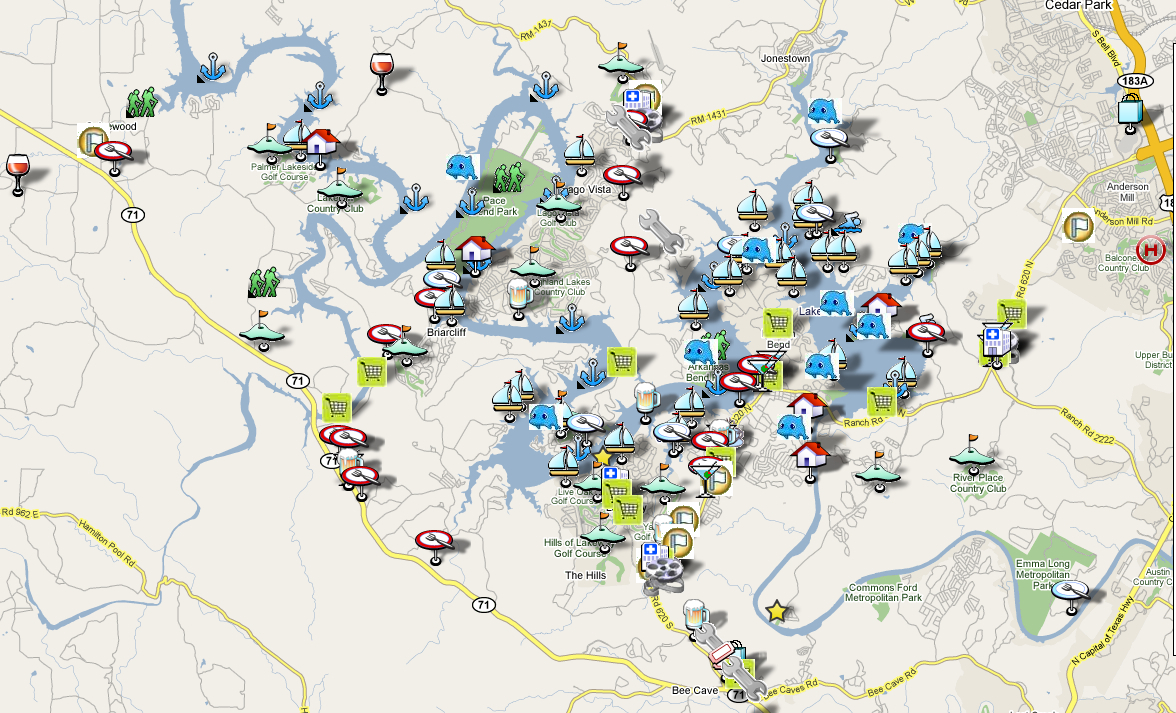
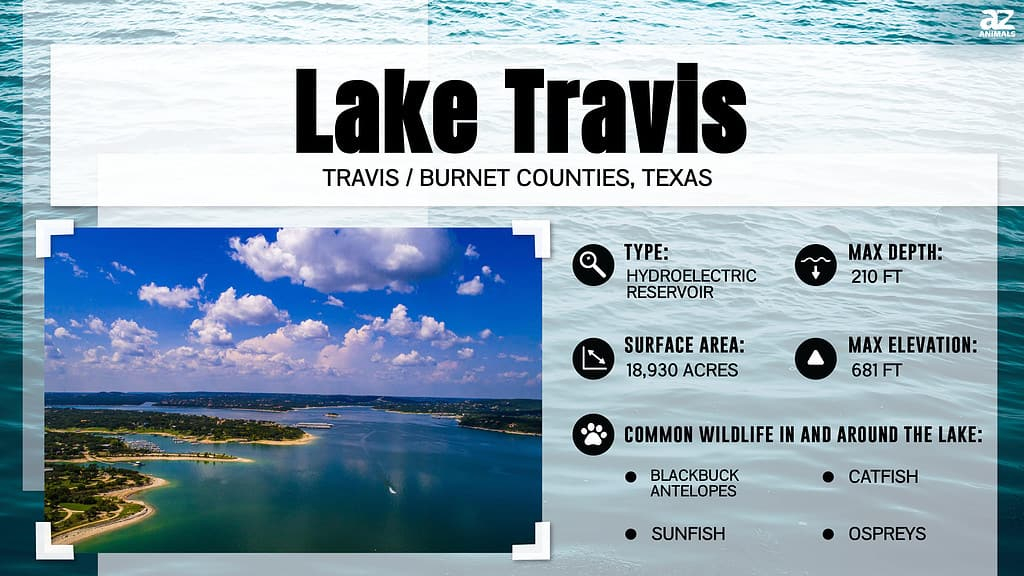
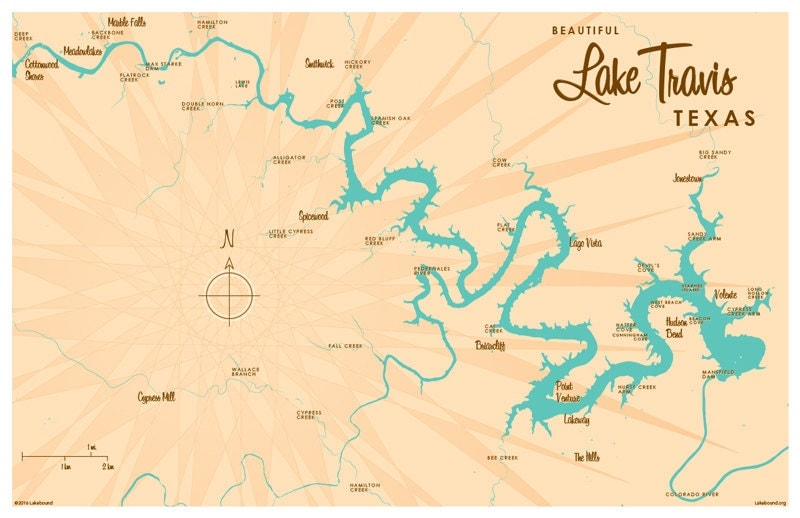
Before we can talk about conservation, we need to understand what we’re trying to protect. Lake Travis sits in the heart of Central Texas, surrounded by rapidly growing suburbs and agricultural areas. Wood Lake, on the other hand, lies in a different environment entirely – a more rural setting with fewer development pressures. Both lakes face similar challenges but respond differently to management strategies. The first step in any conservation effort is to map the landscape thoroughly. This means looking at everything from water quality measurements to land use patterns, from wildlife habitats to erosion risks. The cartographic studies conducted on both lakes show us that every square inch matters. When researchers mapped out the watershed areas, they found surprising connections between upstream activities and downstream conditions. For instance, runoff from urban areas near Lake Travis showed higher nutrient levels than expected. Meanwhile, Wood Lake’s more controlled environment revealed how effective low-impact development practices could dramatically reduce pollution loads. The maps didn’t just show locations – they told stories of cause and effect.
Water Quality Patterns Revealed
One of the most powerful aspects of cartographic studies is their ability to show trends over time. When scientists began mapping water quality around Lake Travis, they noticed something interesting. Certain areas consistently showed elevated nitrogen and phosphorus levels, especially during spring months. These weren’t random fluctuations – they were patterns that corresponded directly to specific land uses. Agricultural runoff was clearly visible on the maps, appearing as bright spots in areas where fertilizers were heavily applied. But here’s where it gets fascinating: when conservation programs started implementing buffer zones and better farming practices, those same patterns changed dramatically. The maps became cleaner, showing reduced nutrient loads in previously problematic areas. Wood Lake provided a different but equally important example. Because it had fewer external pressures, researchers could study the natural recovery process more clearly. They watched as water clarity improved over several years, with the maps showing increased dissolved oxygen levels and decreased algae blooms. The visual representation made it impossible to ignore the positive impacts of targeted conservation efforts. These geographic patterns helped researchers understand which interventions worked best in different environments. The data became a kind of GPS for future conservation work.
Habitat Mapping and Wildlife Corridors
Wildlife conservation isn’t just about counting animals – it’s about understanding where they live, how they move, and what they need to survive. Cartographic studies of both lakes have mapped not just the water itself, but the surrounding habitats that support diverse species. At Lake Travis, researchers discovered that certain shoreline areas served as critical nesting sites for native birds. The maps showed how development had fragmented these corridors, creating barriers that prevented animals from accessing essential feeding and breeding grounds. By identifying these gaps, conservationists could focus their efforts on restoring connectivity. Wood Lake offered a contrasting view. With less human interference, researchers found intact corridors that allowed wildlife to move freely between different habitat types. The maps revealed how these natural pathways supported a rich diversity of species. One particularly striking finding was how the lake’s shallow areas created nursery habitats for fish, with detailed maps showing spawning zones that needed special protection. These habitat maps became crucial planning tools. Communities could see exactly where conservation easements would have the greatest impact. The visual nature of the maps made it easier for stakeholders to understand complex ecological relationships and support protective measures.
Erosion and Sediment Control Strategies
Erosion might sound like a simple concept, but its effects on lake health are profound. Cartographic analysis of both lakes revealed the complex ways that soil loss affects water quality and ecosystem stability. Lake Travis showed significant erosion problems along certain shorelines, particularly in areas where development had removed natural vegetation. The maps tracked sediment loads and identified hotspots where erosion was accelerating. What surprised researchers was how quickly these issues developed – some areas showed dramatic changes over just a few years. Wood Lake, with its more stable environment, provided a baseline for comparison. The contrast between the two lakes helped conservationists understand which approaches were most effective. When they implemented erosion control measures like bioengineering techniques and strategic planting, the maps showed immediate improvements. Sediment loads dropped significantly, and the clearer water allowed aquatic plants to recover. The spatial analysis also revealed that erosion wasn’t just a local problem – it was connected to broader watershed dynamics. Changes in one area could affect water clarity hundreds of feet away. This understanding led to more comprehensive watershed management approaches, where entire drainage basins were considered rather than isolated points.
Climate Resilience and Adaptive Management
As climate patterns shift, lakes face new challenges that require adaptive management strategies. Cartographic studies have shown how temperature variations, precipitation changes, and extreme weather events affect water bodies differently across their landscapes. Lake Travis experienced several intense drought periods that dramatically altered water levels and quality. The maps documented how these changes affected everything from fish populations to shoreline stability. Researchers noted that areas that had been protected through previous conservation efforts showed greater resilience during these stress periods. Wood Lake, while less impacted by extreme drought, revealed how gradual warming trends affected algal growth patterns. The spatial data showed that certain lake zones became more prone to harmful algal blooms as temperatures rose. These findings helped shape more flexible management approaches. Rather than following rigid rules, managers could now adapt based on real-time geographic data. The maps became living documents that changed with conditions. This adaptive approach proved especially valuable during heat waves and flood events. Communities learned to monitor these changes continuously and respond quickly to emerging threats. The cartographic insights helped prioritize resources where they would do the most good.
Community Engagement and Public Participation
Perhaps the most important lesson from both lakes is how mapping can bring communities together around conservation goals. When residents could see their neighborhoods represented on conservation maps, they became invested in protecting those areas. At Lake Travis, community members used the maps to advocate for better stormwater management in their neighborhoods. They could point to specific locations where runoff was causing problems and demand action. Wood Lake showed how public participation could be even more effective in less developed areas. The clear visual evidence made it easy for people to understand complex environmental issues. Local schools started using the maps in their curriculum, helping students connect learning to real-world conservation efforts. Volunteer groups formed around specific mapped priorities, like protecting nesting areas or cleaning up shoreline debris. The maps also helped bridge communication gaps between different stakeholder groups – farmers, developers, environmentalists, and residents all found common ground when they could see shared interests on the same visual representation. This collaborative approach led to more sustainable conservation outcomes because everyone understood their role in the larger picture.
The lessons learned from Lake Travis and Wood Lake extend far beyond their shores. These cartographic studies demonstrate that conservation isn’t just about protecting individual species or water quality parameters – it’s about understanding complex systems and how they interact. When we map our natural resources, we gain insights that would otherwise remain hidden. The visual nature of geographic data makes it easier for everyone to understand environmental challenges and solutions. Whether you’re a policy maker, a community leader, or just someone who cares about clean water, these lake studies offer practical guidance. The key takeaway is that effective conservation requires both scientific rigor and community engagement. Maps provide the bridge between technical knowledge and public understanding. As we face increasing environmental pressures, these lessons will become even more valuable. The next time you see a lake, remember that behind its surface lies a complex web of interactions waiting to be mapped, understood, and protected. These two lakes have shown us that with careful observation and thoughtful action, we can preserve our water resources for generations to come. The question isn’t whether we can save our lakes – it’s how quickly we can apply these proven strategies elsewhere.
[sps_html tag=”img” src=”https://cdn.theartssection.com/wp-content/uploads/2025/11/lake-travis-texas-printable-map-lake-travis-wall-art-lake-etsy-with-regard-to-guide-to-lake-travis-and-wood-lake-using-the-small-framed-map.jpg” alt=”Lake Travis Texas Printable Map Lake Travis Wall Art Lake | Etsy with regard to Guide to Lake Travis and Wood Lake Using the Small Framed Map” style=”width: 100%; height: auto;”]
[sps_html tag=”img” src=”https://cdn.theartssection.com/wp-content/uploads/2025/11/maps-of-lake-travis-with-guide-to-lake-travis-and-wood-lake-using-the-small-framed-map.jpg” alt=”Maps Of Lake Travis with Guide to Lake Travis and Wood Lake Using the Small Framed Map” style=”width: 100%; height: auto;”]
[sps_html tag=”img” src=”https://cdn.theartssection.com/wp-content/uploads/2025/11/discover-the-deepest-lake-in-travis-county-a-z-animals-with-regard-to-guide-to-lake-travis-and-wood-lake-using-the-small-framed-map.jpg” alt=”Discover The Deepest Lake In Travis County - A-Z Animals with regard to Guide to Lake Travis and Wood Lake Using the Small Framed Map” style=”width: 100%; height: auto;”]
[sps_html tag=”img” src=”https://cdn.theartssection.com/wp-content/uploads/2025/11/lake-travis-tx-map-print-for-lake-travis-texas-wood-lake-map-small-framed.jpg” alt=”Lake Travis Tx Map Print for Lake Travis, Texas-Wood Lake Map, Small Framed” style=”width: 100%; height: auto;”]
[sps_html tag=”img” src=”https://cdn.theartssection.com/wp-content/uploads/2025/11/lake-travis-texas-laser-cut-wood-map-lake-travis-wood-map-framed-regarding-guide-to-lake-travis-and-wood-lake-using-the-small-framed-map.jpg” alt=”Lake Travis, Texas - Laser Cut Wood Map | Lake Travis, Wood Map, Framed … regarding Guide to Lake Travis and Wood Lake Using the Small Framed Map” style=”width: 100%; height: auto;”]